Blog Archive

Wednesday, July 25, 2012

SCOPE BASELINE = PSS+WBS+WBS DICT


Let scrutinize-Many pending scope change requests, Some will turn in appd change request.This will affect scope baseline and requires updating scope baseline.Scope baseline contains - project scope statements, WBS and WBS dictionary.If I put a sequence


Monday, July 23, 2012

PM WILL HAVE 4 CHANNELS - FOR - http://pmzilla.com/comm-ch#comment-17471

EVERY ONE WILL HAVE 4 CHANNELS ,  

                                     HENCE PM WILL HAVE 4 CHANNELS


Tuesday, July 10, 2012

FREE FLOAT AT ACTIVITY J


Here activity J is on non critical path and if slip by 2 weeks with its early finish date, will not affect the successor activity G, hence free float is only at activity J in this example of 2 weeks.

FLOAT OF ACTIVITY C IS 14 DAYS

Total float also called Float., can occur at non critical path only.
Free float , as per definition , will not affect the early start of successor activity, hence it will not occur at activity c or at any activity in this example.

Wednesday, May 30, 2012

1.645 HAVE 45% AREA FROM MEAN

From -http://www.mathsisfun.com/data/standard-normal-distribution-table.html


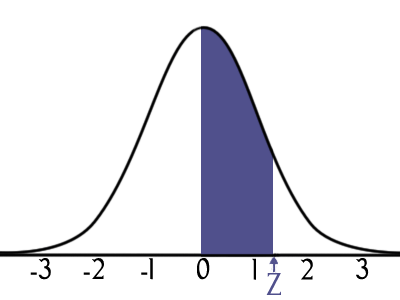
The table below can be used to find the area under the curve from the central line to any "Z-score" value up to 3, in steps of 0.01
This will then tell you what portion of the population are within "Z" standard deviations of the mean.
Instead of one LONG table, we have put the "0.1"s running down, then the "0.01"s running along.
For example, to find the area under the curve between 0 and 0.45, start at the row for 0.4, and read along until 0.45: there is the value 0.1736
Because the curve is symmetrical, the same table can be used for values going either direction, so a negative 0.45 also has an area of 0.1736
Vise versus: 
FOR EXAMPLE GIVEN 29TH MAY POST OF THREE POINT ESTIMATE AND SD
As you know 1σ = has RHS 34.13% area, (for 68.26 % both side,  ±1σ ), 2σ = 47.72% (for 95.45% both side ±2σ), 3σ = 49.87% (99.74%/both side ±3σ), here 1, 2 and 3 are Z score.  If you want to know, how much "times of σ"(Z score) will have 45% (0.45) area from mean, you can get from this table , look at table for nearest of 0.45, 0.4505 and 0.4495, nearest Z score will be from 1st column = 1.60 and next decimal value from top row, will be 0.04 or 0.05 , thus 45% area of curve will be up to at 1.65σ.
Z0.000.010.020.030.040.050.060.070.080.09
0.00.00000.00400.00800.01200.01600.01990.02390.02790.03190.0359
0.10.03980.04380.04780.05170.05570.05960.06360.06750.07140.0753
0.20.07930.08320.08710.09100.09480.09870.10260.10640.11030.1141
0.30.11790.12170.12550.12930.13310.13680.14060.14430.14800.1517
0.40.15540.15910.16280.16640.17000.17360.17720.18080.18440.1879
0.50.19150.19500.19850.20190.20540.20880.21230.21570.21900.2224
0.60.22570.22910.23240.23570.23890.24220.24540.24860.25170.2549
0.70.25800.26110.26420.26730.27040.27340.27640.27940.28230.2852
0.80.28810.29100.29390.29670.29950.30230.30510.30780.31060.3133
0.90.31590.31860.32120.32380.32640.32890.33150.33400.33650.3389
1.00.34130.34380.34610.34850.35080.35310.35540.35770.35990.3621
1.10.36430.36650.36860.37080.37290.37490.37700.37900.38100.3830
1.20.38490.38690.38880.39070.39250.39440.39620.39800.39970.4015
1.30.40320.40490.40660.40820.40990.41150.41310.41470.41620.4177
1.40.41920.42070.42220.42360.42510.42650.42790.42920.43060.4319
1.50.43320.43450.43570.43700.43820.43940.44060.44180.44290.4441
1.60.44520.44630.44740.44840.44950.45050.45150.45250.45350.4545
1.70.45540.45640.45730.45820.45910.45990.46080.46160.46250.4633
1.80.46410.46490.46560.46640.46710.46780.46860.46930.46990.4706
1.90.47130.47190.47260.47320.47380.47440.47500.47560.47610.4767
2.00.47720.47780.47830.47880.47930.47980.48030.48080.48120.4817
2.10.48210.48260.48300.48340.48380.48420.48460.48500.48540.4857
2.20.48610.48640.48680.48710.48750.48780.48810.48840.48870.4890
2.30.48930.48960.48980.49010.49040.49060.49090.49110.49130.4916
2.40.49180.49200.49220.49250.49270.49290.49310.49320.49340.4936
2.50.49380.49400.49410.49430.49450.49460.49480.49490.49510.4952
2.60.49530.49550.49560.49570.49590.49600.49610.49620.49630.4964
2.70.49650.49660.49670.49680.49690.49700.49710.49720.49730.4974
2.80.49740.49750.49760.49770.49770.49780.49790.49790.49800.4981
2.90.49810.49820.49820.49830.49840.49840.49850.49850.49860.4986
3.00.49870.49870.49870.49880.49880.49890.49890.49890.49900.4990

Tuesday, May 29, 2012

NORMAL AND BETA DISTRIBUTION THEORY


QUESTION
A project manager has been asked by the client to meet the promise date of the project. The project manager analyzes the schedule before promising a date to the customer. The project manager uses the program evaluation and review technique to evaluate the project schedule. She decides that based on the PERT calculations she can promise a delivery date of June 30. The expected value of the project completion date is May 30. If the project manager is willing to accept a 5% probability that the project will be delivered later than June 30, what is the standard deviation of the duration of the activities on the critical path? Assume a five-day workweek.
a. Ten days

b. Fifteen days

c. One-half month

d. One month
Answer --- b

FEW COMMENTS


Most of the places I saw that this question is wrongly answered as option C =45 days(one and half month), without any justification.
I saw a blog in PMHUB, and many other sites , all are just copying , as 45 days without knowing the reasons why.
Some of them are little adding it with 95 % probability (appx) of 2sigma and thus of normal distribution but still they are answering 1.50month.
If It is by 2sigma of NDC, then one sigma = 31/2= 15days appx, also answer comes B. But it is wrong approach.
at here 95 % is different then
what
shown in NDC figure
see 47.87 (LHS)+47.87(RHS) = 95.73 %
where as in question it is
50(LHS) + 45 (RHS) = 95%
it makes a great difference
47.87-45 = 2.87%
with this difference at ends (flattered curve) = 45will give 1.65SIGMA, (value of Z, in Z score curve), while 47.87 will give  = 2sigma.
-------------------------------------------------------------------------------------------------------
It can be checked in Excel program also
There is one formula  NORMINV ( prob %age in decimal, MEAN DATE, SD) will give END date (pessimestic date).
But in this question given  M = a Mean date, Prob %age = 95% and End date and asking SD =?
Could not be solved , directly.
But by indirect , by GOAL seek function of Excel  =
Putting in formula NORMINV (0.95,30th May,SD) = 30th of June, by goal seek will give SD = 18.80 days( it also works on Normal Distribution Curve theory)
-----------------------------------------------------------------------------------------------------------------------------------------
BY PERT  formula SD = P-O/6, Beta distribution , weighted average, method
Assuming -3sigma as Optimistic values = 3*31/1.645= 54 days, and pessimistic as cutoff date at 95% prob = 31 days from mean
= p-o/6 = 85/6  =14.1 appx = 15 days.
--------------------------------------------------------------------------------------------------------------------------
By no  other way answer will come.

NORMAL DISTRIBUTION CURVE


For more detail Refer this thread    -   http://www.mathsisfun.com/data/standard-normal-distribution.html

Sunday, April 15, 2012

CRITICAL PATH


PMP -POINT OF TOTAL ASSUMPTION

PROOF OF FORMULA
IN ABOVE FIGURE 
TC + (BSR X COST  OVER RUN)+ TF = CP    ------ eq 1 
TC + COST OVER RUN  = PTA                         -------eq2
COST OVER RUN = PTA -TC                            -------eq3
substitute eq 3 in eq 1
TC + (BSRX (PTA-TC) + TF = CP
TC+TF = TP  ---------------------------------------------eq4
Hence
TP + (BSRX (PTA-TC) = CP
=>(BSRX (PTA-TC) = CP-TP
=>PTA-TC = (CP-TP)/BSR
=> PTA =[(CP-TP)/BSR]+TC

Here CP= Cieling Price TC = Target Cost,  TF = Target Fee /Target Profit, TP=Target Price, BSR= Buyer's Ratio in decimal, PTA = Point of Total Assumption